
ServiceNow integration with grafana
 Working in IT operations team it’s always important to take quick actions on failures, hopefully recognized by the monitoring systems before end-users are affected. Unfortunately, sometimes we have to take actions to solve issues reported by users, in my company we use service-now as IT operations management solution. Whenever an incident is assigned to one of my groups I’m notified, however, overviewing incidents status for the whole team is really possible only on application web page. Wouldn’t it be nice to have simple table with open incidents on our grafana dashboard? If you’d like to implement such functionality you’ll find my approach explained in this article.
All information about incidents in ServiceNow is available over their API, which is well explained in the on-line documentation [1]. It’s not very convenient – listing of incidents is done as simple GET operation with the options passed in query string, but it’s functional, an example request retrieving all incidents from SNOW may look like:
curl -G --data-urlencode "active=true" --header "Accpet: application/json" --user user:pass https://instance.service-now.com/api/now/table/incident
The best fully featured way to integrate ServiceNow with grafana would be to use a dedicated data source plugin in Grafana. Unfortunately, such a plugin was not available at the time of writing this article. Plugin development requires TypeScript/Angular knowledge and I’m totally green in this field. Looking for quicker option I’ve got the hint on Grafana community forum [2] – SimpleJson data source [3].
SimpleJson data source plugin retrieves data over easy REST API from the configurable URL. Thanks to that my case was simplified to development of proxy that will translate SimpleJson calls into calls to ServiceNow API. I’ve implemented my “translator” in python – you can check the whole project on github [4], the main code is presented on the listing below.
        def do_POST(self):
            content_len=int(self.headers.getheader('content-length',0))
            received=self.rfile.read(content_len)
            received=json.loads(received)
            if self.path=='/annotation':
                self._set_headers()
                try:
                    rjson=json.loads(received)
                    annoReply='[{"annotation:": '+rjson["annotation"]["name"]+', "time": "0", "title": "Snow title"}]'
                    self.wfile.write(annoReply)
                except ValueError:
                    print("Received incorrect json")
            elif self.path=="/search":

                response=["SELECT incident_number,assigned_to_last_name FROM incidents where incident_state not in 6,7,8"]
                self._set_headers()
                self.wfile.write(json.dumps(response));
            elif self.path=='/query':
                incidents_description= { "1": "New" , "2": "Assigned", "12": "Referred", "4": "Await User", "5": "Await Evidance", "10": "Await Change", "8": "Await Vendor", "11": "Await Vendor Change", "6": "Resolved", "7": "Closed"}
                self._set_headers()
                now=calendar.timegm(time.gmtime())
                queryReply=[{}]
                if (now - self.lastQueryReply[0] > 60):
                    #Do request to service-now
                    snow = requests.Session()
                    snow.headers.update({"Accept": "application/json" })
                    snow.auth=self.snowAuth
                    snow.verify=False
                    r=snow.get(self.snowUrl+"//api/now/table/incident",params=self.snowFilter)incidents=r.json()
                    queryReply[0]["columns"]=[{"text": "Number", "type": "string"}, {"text": "Assigned to", "type": "string"}, { "text": "Incident state", "type": "string"}]
                    queryReply[0]["rows"]=[]
                    for incident in incidents["result"]:
                        try:

                            if(incident["assigned_to"]==""):
                                queryReply[0]["rows"].append([ incident["number"], "unassigned" , incidents_description[incident["incident_state"]]] )
                            else:
                                queryReply[0]["rows"].append([ incident["number"],  self.knownUsers[incident["assigned_to"]["value"]] , incidents_description[incident["incident_state"]]])

                        except KeyError:
                            self.knownUsers[incident["assigned_to"]["value"]]=self._get_person_by_link(incident["assigned_to"]["link"])["last_name"]
                            queryReply[0]["rows"].append([ incident["number"],  self.knownUsers[incident["assigned_to"]["value"]], incidents_description[incident["incident_state"]]])

                    queryReply[0]["type"]="table"
                    self.lastQueryReply[1]=queryReply
                    self.lastQueryReply[0]=now
                else:
                    queryReply=self.lastQueryReply[1]
                    cacheAge=now - self.lastQueryReply[0]
self.wfile.write(json.dumps(queryReply))
It’s basically a derivative of BaseHTTPServer implementing SimpleJson requirements (To provide configuration parsing in “__main__ section” this is really a class factory). To fulfil SimpleJson requirements for GET method we just have to reply with 200 – this is used by grafana to check the data source when added. Other queries are implemented as POST and data is passed in JSON format. As you see in the listing above there are 3 endpoints implemented “/annotations”, “/search” and “/query”. For this plugin the really important one is “/query”, which is called whenever grafana needs to reload the dashboard. It will send a request specification in JSON format with information about the date interval of interest and targets. Target is query defined in “Metrics” tab for panel plugin configuration – in 1st version which I’m sharing here I don’t care about that – my “proxy” always returns incidents assigned to my group that are not resolved or closed ( states 6 and 7 in ServiceNow).
 To make sure that queries originated from grafana used by multiple users are not going to put additional load on ServiceNow (and to make it faster, because reaching out to externally hosted web service from corporate environment over proxy may be time consuming operation) the reply is cached by snow-grafana-proxy for 60 seconds.
OK.. having all that said it’s high time to explain how to use this in your environment. Simply clone/copy the snow-grafana-proxy.py from github to the server where you’re grafana service is running.
Change URL(should be your ServiceNow instance), user,password and filter parameters in configuration file. In filter configuration you’ll need to put your assignment group identifier. Start the service, simply execute: ./snow-grafana-proxy.sh. For production use you’ll need to write your own unit file or if you’re using non-systemd Linux distribution you can also use init script from my repo (especially if you’re on “chkconfig” distro).
Yes! I’m still on RHEL/Centos6, since I’m totally against systemd, however, a few weeks ago I was kind of systemd defender trying to make a point for it discussing with my colleagues. My argument was that it’s easier to write your own unit file than it was with classic rc.d. Check the script I’ve written for the service – is it complicated? No. I was wrong and systemd in this field resolves non-existent issue.
Then make sure that SimpleJson data source plugin is installed in your grafana plugins directory [5], you can use this command:
grafana-cli plugins install grafana-simple-json-datasource
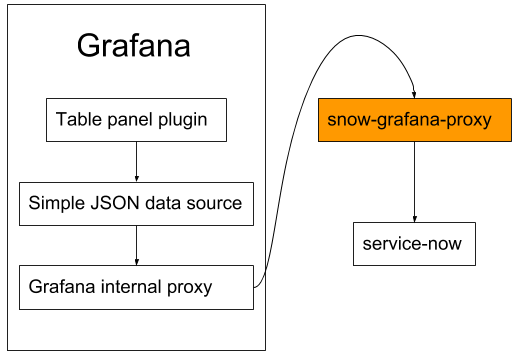
Next go to your grafana web interface and add simple-json-datasource. Make sure that you enabled internal grafana proxy since the proxy doesn’t support CORS and if you use example configuration it will listen on loopback interface. When you’re done with data source add table panel to your dashboard and in metrics tab change data source to the name you gave for the added SimpleJson. That’s all! You can configure query string template, in fact there will be one returned from grafana-snow-proxy, but.. as I mentioned the service doesn’t care about that - it returns the same data regardless of the query. If who talks to whom sequence is not clear for you please check the attached diagram.
Interested in additional functionalities - feel free to open an issue or pull request on github.
If you are interested in other articles from me (not necessarilly about ServiceNow) visit my blog: funinit.wordpress.com.
[1] https://docs.servicenow.com/bundle/geneva-servicenow-platform/page/integrate/inbound_rest/task/t_Get...
[2] https://community.grafana.com/
[3] https://github.com/grafana/simple-json-datasource
[4] https://github.com/cinek810/snow-grafana-proxy
[5] https://grafana.com/plugins/grafana-simple-json-datasource/installation
https://www.servicenow.com/community/developer-articles/servicenow-integration-with-grafana/ta-p/2329901