
Case Study: How ServiceNow Support uses Machine Learning to Predict Customer Escalations
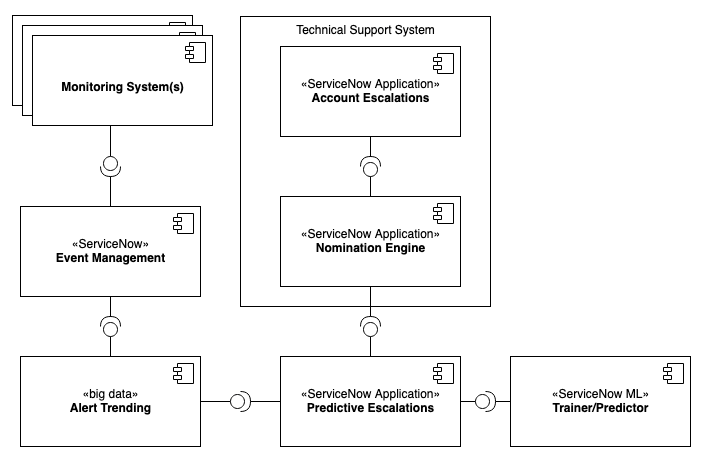
ServiceNow Support is always seeking to be more proactive in dealing with customer impacting issues. This project uses two ServiceNow products ServiceNow® Predictive Intelligence™ and ServiceNow® Event Management, together with the ServiceNow® Platform to predict customers whose experience with ServiceNow is heading in the wrong direction. The premise is that by applying machine learning to the body of performance related events, relative to known customer escalations, we can predict other customers in danger of escalation and reach out to them before smoke turns to fire.
System Diagram

Terminology
Model: In Machine Learning, a Model refers generally to the idea of using mathematics to model desired real world behavior. Models detect the hidden patterns within data.
Solution: In Machine Learning, a Solution is the result of training a model. A given model might be trained multiple times with different combinations of training data or feature criteria, resulting in multiple Solutions.
Classification: A supervised machine learning model type that groups phenomenon into mutually exclusive classes. In our model we use binary classification. We classify each entry as either "Proposed" or "Not Proposed" for each day. At the time of creating our model, ServiceNow offered two variants for Classification, Logistic Regression and XGBoost.
Label: In supervised learning, a label is a human designation of some desired outcome in a body of data. Machines use labels to learn how to organize phenomena in that data into groups. Our SME's reviewed 28 days worth of Event Management trend data for thousands of instances to decide if the trends seemed to warrant being proposed for an escalation. We used a custom field, "Escalation Decision", as our label and gave it either the value "Proposed" or "Not Proposed".
T raining Set: In Supervised Learning, a Training Set is a group of labeled data that is used to generate a ML Solution. The solution is then used to output predictions given new input from unlabeled data.
Feature: A feature is a variable of structured data that can act as input to a machine model. It is a characteristic of a phenomenon. Examples of our features include the count of alerts, median duration of alerts, and variance of alert type.
Project Phases
1: POC (Proof of Concept)
Make sure we had enough empirical data to pass minimal precision and coverage thresholds against a small labeled data set.
2: POV (Proof of Value)
Was it better than what we already had?
To answer that question, we compared the results from our new solution against an existing solution to verify that it could give us (1) net new predictions and (2) earlier predictions for duplicates. Our existing solution also used Alert trending data to proactively identify escalations, but it was more reactive and did not use Machine Learning.
One major finding that the POV helped us realize, was that, to create a truly predictive model, we would need to add in some trending features like Linear Regression, Variance, and Exponential decay, so our ML model had visibility to how data was trending over time.

3: MVP (Minimal Viable Product) - Automating workflows with ServiceNow
Up until this point nothing was automated; it was all spreadsheets, Python, and manually executed scripts. So our next step was to hook up all the systems and use the ServiceNow platform to completely automate the process. This was a highly valuable and rapid exercise – we hit all our milestones early thanks to rapid development process of the ServiceNow® platform.
4: Testing and Revising the Product

With what we had learned during the previous stages, we set off to build the perfect Supervised Solution.
- We started a completely new data collection process to include the new features from the POV and build a larger data set. Then we had our domain experts do massive amounts of manual data labeling to build a Training Set.
- Next, we ranked hundreds of possible features so that we could down-select to just the right combination, that would give us the best predictions. We fed our clean data set into unsupervised learning models (Random Forrest, LogIT, and Decision Matrix) to rank salient features.
- We then tried a few dozen combinations of the highest ranked features to build different Solutions in ServiceNow. We used the Solution Statistics from ServiceNow® Predictive Intelligence™ to quickly narrow this down to only the top performing Solutions.
- Next we compared the detailed outputs of these Solutions by running our Training Set through ServiceNow's ML SolutionFactory API to see the detailed prediction score for each item in the Training Set. This will be described in more detail in the "Solution Selection Analysis" section below.
5: Product Go-Live
Finally we launched the product and started taking escalations. We immediately saw the value of the new model. We let our new and old models run in parallel for a few months and, in the end, we found that each model provided enough unique value to keep them both.
Solution Selection Analysis
So how did we evaluate which Solution was giving us the best results? We are a small team of engineers. Reviewing nominated instances can be extremely time consuming. So, in terms of model output, we knew that minimizing false positives was most important. Having engineers spend significant time ‘spinning their wheels’ would be a huge waste of resources. The ServiceNow® Predictive Intelligence™ tool provides Solution Statistics so that you can automatically evaluate the quality of your models.
- Precision told us, out of those predicted "Proposed", how many were correct predictions.
- Recall told us, out of the total that were labeled "Proposed", how many were predicted "Proposed".
- Coverage told us, out of all the records in the training set, how many could we make some type of confident prediction – either "Proposed" or "Not Proposed".

Since reducing false positives was so important to us, PRECISION was a much more important factor than RECALL or COVERAGE. These estimated solutions let us quickly eliminate some of our early models. For models which looked good, we then used ServiceNow's MLSolutionFactory API to get the prediction results for each and every entry in our training set. We used these results to perform a deeper analysis, selecting the models that gave us a very low number of false positives without missing too many obvious escalations.
Conclusion
Ultimately, we landed on a binary classification model using 19 features, leveraging the XGBoost gradient boosting library. This gave us the accuracy we needed without wasting our engineer’s time, giving only a 3% false positive rate.
Since going live with our predictive model, we have engaged hundreds of customer per year and moved from only 11% proactive engagements to now 68% of our engagements being proactive!

https://www.servicenow.com/community/ai-intelligence-articles/case-study-how-servicenow-support-uses-machine-learning-to/ta-p/2895321