
Tanium Service Graph Connector
Current Version: 1.6
Sample Application Service to Monitor: MediaWiki
URL: http://10.197.203.212:5000/mediawiki
Tanium Configuration: Tanium Cloud Based Instance (as oppose to Tanium on-premises instance)
Software Asset Management Enabled(Yes\No): Yes
A 2-Tier PHP-based Web Application running on a 5 VM Node configuration in our Crucible Lab Environment will be used to demonstrate the Tanium Service Graph Connector.
Environment:
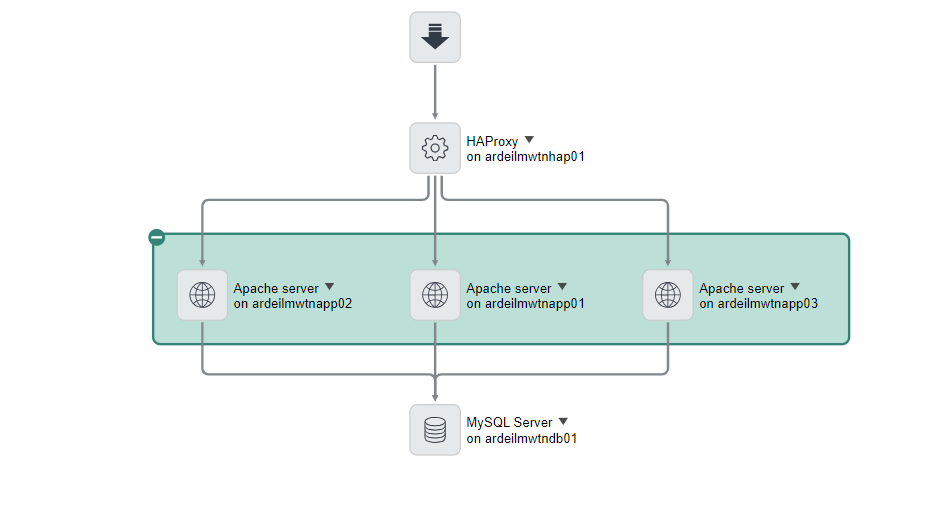
HAProxy Load Balancer (ardeilmwtnhap01) routes Web Requests to an Apache Web Server Cluster (ardeilmwtnapp01, ardeilmwtnapp02, ardeilmwtnapp03) that has the MediaWiki Application installed and running. The MediaWiki (PHP) Application in turn routes DB Requests to a MySQL Server DB (ardeilmwtndb01) as depicted in the top-down discovered Application Service Map below.

This MediaWiki Application is being monitored by the Tanium SaaS Asset Management cloud-based solution, where all application-component data with respect to the application is stored.
The following topics are covered in this How do I configure the Tanium Service Graph Connector? Article:
A. Set up Application to be monitored in Tanium Cloud
B. Analyze your Application Assets in Tanium Cloud
C. Installing & Configuring Tanium Service Graph Connector on your ServiceNow Instance
D. Run Tanium Service Graph Connector Scheduled Data Import Jobs on your ServiceNow Instance
E. Analyze the CMDB Records created\updated by the Tanium Service Graph Connector for your Application in your ServiceNow Instance
F. Tanium Software Usage - Relevant only when Software Asset Management Professional(SAM Pro) is enabled
A. Set up Application to be monitored in Tanium Cloud
(i) Log into your company's Tanium Cloud Instance
(ii) Install Tanium Client Agents on VM's containing Application components to be monitored, e.g. MediaWiki - Deploying the Tanium Client using an installer or package file
- Navigate to Shared Services, Client Management from Left Hand Menu
- Click on Download Installers
- Select the Installer Package for the Operating System that your Application components run on, e.g. Linux
- This downloads the Installer Package and an <operating system>-client-bundle zip file onto your machine.
- Upload this zip file to each of your VM's and unzip the file to a directory of your choice
- Follow the instructions on your Deploy the Tanium Client to <Operating system> endpoints using Package files Documentation page, e.g. - Deploy the Tanium Client to Linux endpoints using package files to install Tanium Client on the VM's containing the Application to be monitored, e.g. MediaWiki
- Tanium Client makes outbound TCP connections to a non-standard port, port 17472 on your Tanium Cloud Instance - Refer to the Host and Security Requirements section in the Tanium Cloud Requirements documentation for more details.
- Execute an Operating System specific command from your VM's to verify that your VM's can make outgoing TCP connections to Port 17472 on your Tanium Cloud Instance. For example, the nc -vz your Tanium Instance Host Name 17472 Unix Command or the Telnet your Tanium Instance Host Name 17472 Windows Command (from a Windows Command Shell).
- If you get a connection timeout error message like e.g. the "Ncat: Connection timed out" Ncat Unix error message it indicates that your Internal Firewall is blocking TCP traffic from communicating over this Port. You will need to get your Network Security Administrator to open this Port for TCP based Traffic.
Best Practice outlined in the Host and Security Requirements section in Tanium Cloud Requirements: Tanium recommends that you configure firewall policies to open ports for Tanium traffic with TCP-based rules instead of Application identity-based rules
(iii) Go back to your company's Tanium Cloud Instance Home Page to verify that your VM's successfully registered with your Tanium Cloud Instance
- You should see an Online Endpoints Tile showing the Number of VM's that you have successfully registered with your Tanium Cloud Instance
- Click on this Online Endpoints Tile to see your list of VM's.
Below is an example of this for the 5 MediaWiki Application VMs in our Crucible Lab Environment.

(iv) Create an API Token specific to your ServiceNow Instance that you will be providing as part of the (iv) Guided Setup step outlined in the C. Installing & Configuring Tanium Service Graph Connector on your ServiceNow Instance Section further down.
- Navigate to Administration, API Tokens from the Left Hand Menu
- Click on the Create API Token Button to bring up the Create API Token Dialog Box. Specify the IP Address associated with your ServiceNow Instance in the Trusted IP Addresses Field.
- For IPv4 IP Addresses, use CIDR notation, e.g. 192.168.0/24.
- For IPv6 IP Addresses, enclose the IPv6 Address in Square Brackets. e.g. [2001:db8:3333:4444:8888] or [2001:db8::]/32
(v) Create a Custom Asset View that will be used by the Tanium Service Graph Connector to query your Tanium Cloud Instance for your Asset related data.
- Navigate to Modules, Assets, Views from the Left Hand Menu
- Click on the Create View pushbutton to display the Create View drop-down menu
- Select the "Create ServiceNow View" option on this menu
- This creates a ServiceNow (reserved) View that you will be cloning to create your own Organization
specific ServiceNow Asset View for editing.
- Click on the Create Copy(+) Icon to the right of the newly created ServiceNow (reserved) View to create your own Organization specific ServiceNow Asset View
- Edit this copy and add the below fields:
- All fields from the SIU Product Usage bucket
- Asset -> Last Seen field
- Network Adapter -> Model field
You will be selecting this new Organization specific ServiceNow View as part of the (iv) Guided Setup step outlined in the C. Installing & Configuring Tanium Service Graph Connector on your ServiceNow Instance Section further down.
B. Analyze your Application Assets in Tanium Cloud
The Tanium Service Graph Connector integrates with the Asset Module in Tanium - Tanium Asset overview
(i) Navigate to Modules, Assets, Reports to display the available list of Tanium Asset Reports
(ii) Select the All Assets Report. You should see a list of your VM Assets displayed.
Below is an example of this for the 5 MediaWiki Application VM Assets in our Crucible Lab Environment

(iii) Double click on any of your VM Assets to bring up the Asset Report for that VM. You will an Asset Details Summary Screen with the following Menu Options for your VM in the Left hand Menu:
- Installed Applications
- Logical Disks
- Network Adapters
- Physical Disks
Below is an example of this for our ardeilmwtnapp01 VM where the Asset Details associated with our ardeilmwtnapp01 VM is displayed.

Installed Applications
(iv) Click on the Installed Applications Menu option to bring up the list of Installed Applications on your VM. Below is an example of this for our ardeilmwtnapp01 VM where the list of Installed Applications installed on the ardeilmwtnapp01 VM is displayed.

Logical Disks
(v) Click on the Logical Disks Menu option to bring up the list of Logical Disks on your VM. Below is an example of this for our ardeilmwtnapp01 VM where the list of Logical Disks on the ardeilmwtnapp01 VM is displayed.

Network Adapters
(vi) Click on the Network Adapters Menu option to bring up the list of Network Adapters on your VM. Below is an example of this for our ardeilmwtnapp01 VM where the list of Network Adapters on the ardeilmwtnapp01 VM is displayed.

Physical Disks
(vii) Click on the Physical Disks Menu option to bring up the list of Physical Disks on your VM. Below is an example of this for our ardeilmwtnapp01 VM where the list of Physical Disks on the ardeilmwtnapp01 VM is displayed.

C. Installing & Configuring Tanium Service Graph Connector on your ServiceNow Instance
(i) Login to your ServiceNow Instance
(ii) Install the following Applications & Plugins in the order shown:
Applications
- Integrations Commons for CMDB: sn_cmdb_int_util
- CMDB CI Class Model: sn_cmdb_ci_class
- ITOM Discovery License: com.snc.itom.discovery.license (Included with full Discovery Product)
- Service Graph Connector for Tanium: sn_tanium_integ
Plugins
5. com.glide.hub.action_type.datastream Plugin (ServiceNow IntegrationHub Action Template - Data Stream) - click on the Request Plugin Button from the System Applications Screen
(iii) Navigate to Setup under Tanium in the Filter Menu
(iv) Go through all Guided Setup Steps as per the ServiceNow Documentation: Configure Service Graph Connector for Tanium
Configuring the Connection and Credentials
Your ServiceNow Instance will be authenticating to your Tanium Cloud Instance using Token based Authentication as oppose to Basic Authentication. Specify the following in the below Configure the Connection and Credentials section steps*:*
- Set authentication type - Specify token to indicate that your ServiceNow Instance will be authenticating to the Tanium Cloud Instance using Token based Authentication
Tanium Cloud processes Tanium REST API HTTP Requests from External Applications via an API Gateway that is expecting an API Token Key to be provided for the Session Parameter in the Header section of the HTTP Requests. This is why token is specified for authentication type.
Note: Tanium On-Prem REST API's can be authenticated with via Basic User Name\Password Authentication as well as API Token Key Authentication. For Basic User Name\Password Authentication basic is specified for authentication type.
- Configure the Token Auth Credentials - Specify the API Token Key you created earlier in the (iv) Create an API Token step in the A. Set up Application to be monitored in Tanium Cloud section above.
- The OOTB SG Tanium Token Auth Credential Credential Record will be updated at the end of this step.
Note: According to Tanium API Token Best Practices, API Tokens should not be shared across ServiceNow Instances. The Tanium Service Graph Connector has implemented Auto-Rotation for Tanium API Tokens ( as per Tanium API Token Best Practices) meaning that when a ServiceNow Instance's API Token is rotated the API Token is then invalid for any other ServiceNow Instances that may be attempting to use it.
Please refer to the Tanium Managing API tokens Documentation Page for more details on Tanium API Token Best Practices.
- Click on the Configure pushbutton to the right of Configure the Connection to bring up the below Dialog Box:

Name Field: Prepopulated with the Name of the OOTB SG Tanium Token Auth Connection Connection Record.
Credential Field: Prepopulated with the SG Tanium Token Auth Credential Credential Record from the previous Configure the Token Auth Credentials step.
Connection alias Field: Prepopulated with the OOTB Parent SG Tanium Token Auth Connection Alias Connection & Credential Alias Record.
Any Child Connection & Credential Aliases that may be created in the Add Multi Instances section in Guided Setup (described further down) will be associated with this Parent Connection & Credential Alias.
Host Field: Specify your Tanium Cloud Instance Host Name
- Click on the Configure pushbutton to the right of Configure the View to bring up the below SG Tanium View Set Up Screen:

The Pulldown Menu on the this Screen is prepopulated with all available Custom Asset Views in your Tanium Cloud Instance. Your ServiceNow Instance makes an API call to your Tanium Cloud Instance in order to get these Custom Asset Views. The SG Tanium Token Auth Connection Alias Connection & Credential Alias that you created in the previous step is used for authentication with your Tanium Cloud Instance.
Crucible Lab shown in the Pulldown Menu in the above screen is one of the Custom Asset Views in our Tanium Cloud Instance that was returned by this API call.
Note: If you get an "Unable to retrieve views from the Tanium server. Please check your connection and credentials" Error Message when you click on the Configure Pushbutton this generally means that the API Token that you created in your Tanium Cloud Instance has been shared with a different ServiceNow Instance. As per the Note in the above Configure the Token Auth Credentials step, the Tanium Service Graph Connector has implemented Auto-Rotation for Tanium API Tokens. This means that the 2nd ServiceNow Instance that the API Token has been shared with has rotated the Tanium API Token making it valid for the 2nd ServiceNow Instance but invalid for your ServiceNow Instance. You should check to see if another ServiceNow Instance is using the API Token that you created.
- Select the Organization specific ServiceNow View you created earlier in the (v) Create a Custom View step in the A. Set up Application to be monitored in Tanium Cloud section above and click on the Set View Pushbutton. The Tanium Service Graph Connector on your ServiceNow Instance is now configured to use this View.
Generating Out of the Box Data Sources and Scheduled Imports
Completing all the other steps in the Configure the Connection and Credentials section will trigger the creation of Out of the Box Data Sources and Scheduled Imports. Below are the OOB Scheduled Imports that get created for instances that do not have Software Asset Management Professional installed:

Below are the OOB Scheduled Imports that get created for instances that do have Software Asset Management Professional installed:

You will notice the additional SG-Tanium Usage Scheduled import Job that gets created. This job runs on a Monthly basis and captures Last Used Date data for Software being Tracked in Tanium for your Monitored Windows and MacOS Endpoints. It will be explained in more detail in the F. Tanium Software Usage Section below.
Add Multi Instances
There is an Add Multi Instances section in Guided Setup that is not Mandatory but is recommended even if you are only using One Instance. It allows you to create a set of Data Sources and Scheduled Imports that are specific to your Customer Tanium Instance. This is recommended for the following reasons:
- It is good futureproofing for cases where you may need to connect to a 2nd Data Source sometime in the future. For example a Tanium Data Source in a different Geographical location or a Tanium Data Source in a different company that is acquired through corporate M&A activity.
- It prepares you for future upgrades, where the Customer specific Data Source and Scheduled Data Import Records in the sys_data_source Table will not be marked as Skipped Records for Review by the Upgrade. It will allow you to focus on Skipped Records due to intentional Customization as oppose to Execution of the Out of the Box Scheduled Imports.
Go through all the steps in this Add Multi Instances section to specify Customer specific Data Sources and Scheduled Imports. Pay particular attention to the below steps in this section:
- Add another Token Auth Connection step - Clicking on the Configure button brings you to the Flow Designer
- The SG Tanium Token Auth Connection Alias Connection & Credential Alias from the prior Configure the Connection and Credentials section is shown on the Left hand side of the Flow Designer Screen.
- The already existing Connections that are associated with this Connection & Credential Alias are shown on the right hand side of the Flow Designer screen. For example the Out of the Box SG Tanium Token Auth Connection Connection you updated in the prior Configure the Connection and Credentials section.
- Click on the Add Connection button in Flow Designer to bring up the Create Connection Dialog box shown below:

- What is specified in the Connection Name field will be used as part of the naming convention for the newly created Customer Specific Data Sources & Import Sets as per below:
| Customer Specific Scheduled Import Jobs | Connection Name - Import Job Name |
|---|---|
| Customer Specific Data Sources | Data Source Name - Connection Name |
So in the Connection Name field, populate it with something that will enable you to identify the associated Customer specific Data Source & Scheduled Imports easily after they are created. For example, Europe was specified for our Connection to establish the location that our Tanium Cloud Instance is based in.
Specify your T*anium Host Instance URL* and Token API Key in the other fields on this Dialog Box. Clicking on the Create Connection button creates a Child Connection & Credential Alias that is associated with the Parent "SG Tanium Token Auth Connection Alias" Connection & Credential Alias already displayed in Flow Designer
- Generate Data Sources and Scheduled Imports step
Click on Configure to the right of Generate Data Sources and Scheduled Imports to bring up the Dialog box shown below:

Connection and Credentials Alias Field: Specify the Child Connection & Credential Alias you created in the above step.
View Field: Click on the Search icon. A View Name Dialog Box will be displayed with all the available Views in the Instance you're connecting to via the Child Connection & Credential Alias (These will have been created in this Instance in a similar way to how you created the Custom View in step (iv) of the A. Set up Application to be monitored in Tanium Cloud section).
An example of the Customer specific Data Sources and Scheduled Imports that get created when you have finished all the other steps in this section is shown below, where Europe was what was used to identify our Customer specific Schedule Imports and Data Sources:

D. Run Tanium Service Graph Connector Scheduled Data Import Jobs on your ServiceNow Instance
(i) Navigate to Scheduled Data Imports under Tanium in the Filter Menu. 4 Scheduled Data Imports should be listed, with 3 of the 4 being marked Active as shown below.
(ii) Open your SG-Tanium Hardware and Software Parent Scheduled Import job record, for example the Europe - SG Tanium Hardware and Software Scheduled Import Job shown in the above screen shot, and click on the Execute button
(iii) Navigate to Concurrent Import Sets in the Filter Menu.
- Wait for your 2 Active Scheduled Data Import jobs to finish.
Note: The SG-Tanium Applications Import job is currently disabled (Active=False) in this Release. There are plans to enable it in a future release.
E. Analyze the CMDB Records created\updated by the Tanium Service Graph Connector for your Application in your ServiceNow Instance
There are 3 types of Records created by the Tanium Service Graph Connector in the CMDB:
- CMDB CI[cmdb_ci] Records
- Software Installation[cmdb_sam_sw_install] Records - Software Asset Management(SAM) enabled
- Software Instance[cmdb_software_instance] Records - If Software Asset Management(SAM) not enabled
- Serial Number[cmdb_serial_number] Records
CMDB CI Records
(i) Navigate to cmdb_ci.list in the Filter Menu
(ii) Group by Discovery Source
(iii) Navigate to the SG-TaniumSN Discovery Source and double click on its Discovery source:SG-TaniumSN(n) link where n represents the Number of CMDB records(entities) Created\Updated by the Tanium Service Graph Connector.
(iv) Group By Class
A List of CMDB CI Records Created\Updated by the Tanium Service Graph Connector will be displayed grouped by Class. The screen shot below shows all of the Class Records displayed in this Class List for our MediaWiki Application.

- The 5 Linux VM's associated with our MediaWiki Application are listed as Linux Server CI's
- The Network Adapter's, IP Addresses, File System's and Disks associated with each of these Linux Servers are listed as Network Adapter, IP Address, File System and Disk CI Classes respectively. These were populated in turn from their corresponding Network Adapter, IP Address, Logical Disk and Physical Disk Entities in Tanium. The Network Adapter, Logical Disk and Physical Disk Entities for the ardeilmwtnapp01 Linux Server in Tanium are shown in the B. Analyze your Application Assets in Tanium Cloud section above.
The screen shot below shows all the Linux Server specific fields that were populated by the connector for the ardeilmwtnapp01 Linux Server CI created by the Tanium Service Graph Connector, along with the Network Adapter(1), Storage Devices(2), File Systems(3), and CI IPs(1) Tabs that were populated with the Network Adapters, Storage Devices, File Systems and CI IPs records associated with the ardeilmwtnapp01 Linux Server CI respectively. For example, the 00:50:56:96:c8:8f Network Adapter CI shown in the above CMDB CI Class Screen shot is shown in the Network Adapter Tab below.

Notice how the count shown in the Network Adapter, Storage Devices and File System Tabs matches the N*etwork Adapter, Physical Disks* and Logical Disk Entity count shown for the ardeilmwtnapp01 Linux Server in the Screen shots in the B. Analyze your Application Assets in Tanium Cloud section above*.*
Software Installation Records
(i) Navigate to cmdb_sam_sw_install.list in the Filter Menu
(ii) Group by Discovery Source
(iii) Navigate to the SG-TaniumSN Discovery Source and double click on its Discovery source:SG-TaniumSN (n) link where n represents the Number of Software Install Records Created\Updated by the Tanium Service Graph Connector.
(iv) A List of Software Install Records Created\Updated by the Tanium Service Graph Connector will be displayed*.* The screen shot below shows all the Software Install Records Created\Updated by the Tanium Service Graph Connector for our MediaWiki Application.

(v) The screen shot below shows the Software Install Records displayed in this List for our ardeilmwtnapp01 Linux Server(Installed on=ardeilmwtnapp01) .

Notice that 1480 Records are shown at the bottom of the screen. This matches the Software Installations (1480) count in the Software Installations Tab shown above for the ardeilmwtnapp01 Linux Server. It also matches the (1480) count shown in the Tanium Installation Applications Screen Shot i.e.
F. Tanium Software Usage
If you have Software Asset Management Professional (SAM Pro) activated on your ServiceNow Instance, a SG-Tanium Usage Scheduled Import Job is installed with your SG-Tanium Service Graph Connector Installation (as referenced in the Generating Out of the Box Data Sources and Scheduled Imports step in the above C. Installing & Configuring Tanium Service Graph Connector on your ServiceNow Instance section). This job runs on a Monthly basis and captures Last Used Date data for Software being Tracked in Tanium for your Monitored Windows and MacOS Endpoints.
You need to have Software Monitoring enabled on your Tanium Instance for the Products that you want to capture Software Product Usage data for (Refer to Tanium's Monitoring software inventory documentation page for details on how to do this).
For our Tanium Instance we have enabled Software Monitoring for the following software products:
The screenshot below shows Software Monitoring being enabled for these products in our Tanium Instance with the Used Column showing a value of 1 to indicate that the Product has been detected as being Used on our Monitored Windows based Endpoints.

The SG-Tanium Usage Scheduled Import job pulls the previous Month's Last Used Date Usage data for your Windows based Endpoints being monitored by your Tanium Instance. It populates the Software Usage[samp_sw_usage] Table with your Software Product's previous Month's Last Used Date Usage Data but in order for it to do so, you need to have Last Used Date type Reclamation Rules setup for the Software Products that you want to capture Last Used Date Usage data for (Refer to Add a software reclamation rule ServiceNow Documentation Page for details on how to do this).
For all Product Executable records in the SG-Tanium Usage Staging Table, it checks the Reclamation Rules[samp_sw_reclamation_rule] Table for Last Used Date Reclamation Rules. For every Product Record that it finds a Last Used Reclamation Rule for, it populates the Software Usage[samp_sw_usage] Table with Last Used Date Usage data for that Product.
The screen shot below shows Last Used Date Software Usage data for our Notepad++ and Google Chrome Products that have been set up for Software Monitoring in our Tanium Instance and have been detected as being used on our monitored cruwin10tan Windows Endpoint.

https://www.servicenow.com/community/cmdb-articles/tanium-service-graph-connector/ta-p/2754467