
What's new in Cloud Observability?
Import
·
Aug 31, 2023
·
article
The Cloud Observability team makes frequent updates introduce new features, capabilities, and various improvements to the CloudObs App and Unified Data Platform. This article serves as a kind of repository for release notes, and is updated on a regular basis.
Releases detailed on this page focus on improvements to the core Cloud Observability product, and select integrations. Improvements to other capabilities like our APIs, OpenTelemetry integrations, and the Unified Query Language are detailed on our docs site.
August 2023
 Mousing over the drill down feature in a table chart Mousing over the drill down feature in a table chart  Mousing over the drill down feature in a dependency diagram Mousing over the drill down feature in a dependency diagram |
New drill down tools for investigating performance from dependency diagrams from tables with drill down tools |
|---|
July 2023
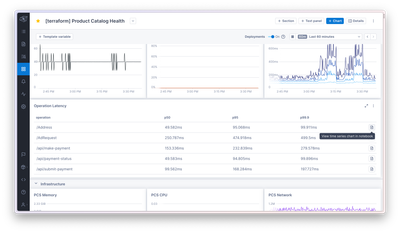
 A pre-built global service health dashboard is shown featuring various SLI and dependency charts, while a mouse hovers over a variable selector to filter the visualizations to a single service A pre-built global service health dashboard is shown featuring various SLI and dependency charts, while a mouse hovers over a variable selector to filter the visualizations to a single service |
Pre-built dashboards for monitoring service health A global service health dashboard is available which uses template variables to allow users to see performance metrics across all services, or filter to a specific service Individual service health dashboards can be generated from the "Add a pre-built dashboard" page Uses trace data for service SLIs, and metric data (as available) for underlying infrastructure health |
|---|
- Updated Cloud Observability datasource plugin for Grafana
- High-efficiency span compression in OpenTelemetry Collectors
- Cloud Observability is proud to support the new Apache Arrow-based compression available in the OpenTelemetry Collectors
- This feature allows organizations to send very-high throughput span data to Cloud Observability using OTLP with a significant reduction in data egress volume, no Microsatellites required.
- Contact your Cloud Observability account team to learn more
- Cloud Observability is proud to support the new Apache Arrow-based compression available in the OpenTelemetry Collectors
- Historical billing analysis for trace data
- Unified Dashboard navigation enhancements
- Improved drop-down menus offer quick links to recent and starred dashboards
- Reduced header footprint increases visualization density without clutter
- New built-in sharing features copy dashboard links while retaining time windows
- Improved drop-down menus offer quick links to recent and starred dashboards
Q2 2023
 The Service Graph Connector for OpenTelemetry available in the ServiceNow Store The Service Graph Connector for OpenTelemetry available in the ServiceNow Store |
Service Graph Connector for OpenTelemetry Now Generally Available, the SGC for OTel utilizes Cloud Observability to bring Cloud-native visibility and health insights into your CMDB Cloud-native CIs are automatically populated from trace and metric data offered through our OpenTelemetry Kubernetes Operator Enables ServiceNow Operations Workspace features including service and infrastructure relationships, inferred services, alert status, and service maps |
|---|---|
 A Unified Telemetry Dashboard shows many new chart types, including markdown panels, table views, and ordered lists - alongside previously-available line charts A Unified Telemetry Dashboard shows many new chart types, including markdown panels, table views, and ordered lists - alongside previously-available line charts |
|
 A slide-over panel shows a new "Create a template variable" feature where users can add a template name, attribute key, and default attribute value in order to apply a variable to all queries on a given dashboard A slide-over panel shows a new "Create a template variable" feature where users can add a template name, attribute key, and default attribute value in order to apply a variable to all queries on a given dashboard |
Template variables Create and manage template variables in Unified Dashboards and Notebooks Utilize template variables in both the Unified Query Builder (UQB) and Query Language (UQL) Leverage template variables in Notebooks using one chart to investigate multiple scenarios |
 Correlation analysis feature compares SLI performance across baseline and deviation time windows, and highlights operations and attributes associated with cross-stack latency, throughput, and error rate changes Correlation analysis feature compares SLI performance across baseline and deviation time windows, and highlights operations and attributes associated with cross-stack latency, throughput, and error rate changes |
Enhanced correlation analysis New correlations highlight cross-stack attributes and operations associated with throughput, latency and error rate changes |
 The "New Alert" workflow in Cloud Observability offers templates to pre-populate a query window with a Composite alert condition. Additional templates include "Custom", "Change", "Anomaly", and "Outlier" The "New Alert" workflow in Cloud Observability offers templates to pre-populate a query window with a Composite alert condition. Additional templates include "Custom", "Change", "Anomaly", and "Outlier" |
Q1 2023
 Dashboard with a dependency diagram chart in the midst of being resized by a user Dashboard with a dependency diagram chart in the midst of being resized by a user |
|
|---|---|
 A dependency diagram chart in Cloud Observability showing service-level dependency health and latency distribution A dependency diagram chart in Cloud Observability showing service-level dependency health and latency distribution |
Custom dependency diagrams charts Generate service and operation dependency diagrams using trace data Filter underlying trace data to generate custom diagrams based on span attribution Limit graph sprawl based on immediate, upstream, and downstream dependencies Available in Unified Dashboards and Notebooks |
 The in-product "Create a pre-built dashboard" menu showing a few available AWS and OpenTelemetry dashboards The in-product "Create a pre-built dashboard" menu showing a few available AWS and OpenTelemetry dashboards |
Pre-built metrics dashboards Quickly clone dashboards created our team to make use of the available metrics sources supported by Cloud Observability, including AWS and OpenTelemetry integrations. |

View original source
https://www.servicenow.com/community/cloud-observability-articles/what-s-new-in-cloud-observability/ta-p/2643675