
Dynatrace Service Graph Connector
Current Version: 1.9
Sample Application Service to Monitor: MediaWiki
URL: http://10.197.203.200:5000/mediawiki
Ingesting Dynatrace Events(Yes\No): Yes
A 2-Tier PHP-based Web Application running on a 5 VM Node configuration in our Crucible Lab Environment will be used to demonstrate the Dynatrace Observability Service Graph Connector.
Environment:
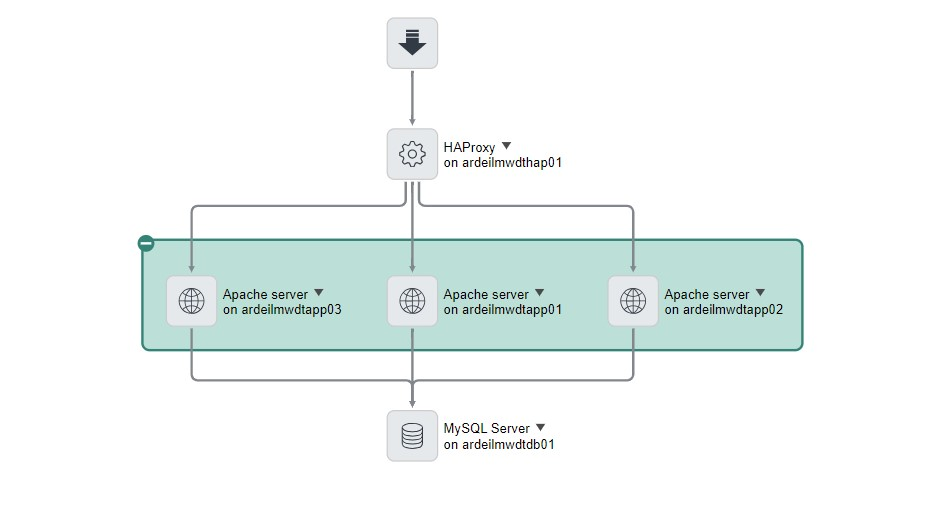
HAProxy Load Balancer (ardeilmwdthap01) routes Web Requests to an Apache Web Server Cluster (ardeilmwdtapp01, ardeilmwdtapp02, ardeilmwdtapp03) that has the MediaWiki Application installed and running. The MediaWiki (PHP) Application in turn routes DB Requests to a MySQL Server DB (ardeilmwdtdb01) as depicted in the top-down discovered Application Service Map below.

This MediaWiki Application is being monitored by the Dynatrace SaaS cloud-based solution, where all application-component data with respect to the application is stored.
The following topics are covered in this How do I configure the Dynatrace Service Graph Connector? Article:
A. Set up Application to be monitored in Dynatrace Cloud
B. Analyze your Application in Dynatrace Cloud
C. Installing & Configuring Dynatrace Service Graph Connector on your ServiceNow Instance
D. Run Dynatrace Service Graph Connector Scheduled Data Import Jobs on your ServiceNow Instance
E. Analyze the Application Service Map created by the Dynatrace Service Graph Connector for your Application in your ServiceNow Instance
F. Analyze the CMDB Records created\updated by the Dynatrace Service Graph Connector for your Application in your ServiceNow Instance
G. Event Management
A. Set up Application to be monitored in Dynatrace Cloud
(i) Log into your company's Dynatrace Cloud Instance
(ii) Install Dynatrace OneAgent on VM's containing Application components to be monitored, e.g. MediaWiki - Install OneAgent on Linux
- Navigate to Deploy Dynatrace under Manage in the Filter Menu
- Click on Start Installation
- Select the Platform that your Application components run on, e.g. Linux
- Enter a PaaS Token, e.g. 'Crucible Lab' (Under Access Tokens)
- Follow the Steps on the Installer Page (Shown when PaaS Token supplied) to install Dynatrace OneAgent on the VM's containing the Application to be monitored, e.g. MediaWiki
- Restart the Processes to be monitored, e.g. Apache Web Server, HAProxy Load Balancer, MySQL Server
(iii) Create Application Detection Rule for Application in Dynatrace - Define applications for Real User Monitoring
- Navigate to Application detection under Manage, Settings, Web & mobile monitoring in the Filter Menu
- Click Add Item to add an Application detection Rule for your Application component, e.g. 'URL Contains' 'http://10.197.203.200:5000/mediawiki'
- Click on the Create a New Application button to create an Application Name to associate with your Application in the Dynatrace Cloud environment, e.g. MediaWiki
(iv) Setup RUM Injection method for Application - RUM JavaScript Injection
- Navigate to Front End under Application Observability in the Filter Menu
- Select the Application Name that you created in step (iii) e.g. MediaWiki
- Click on the Context Menu(...) button on the Top Right of the screen and then select Edit from the Menu Pulldown to bring up the Application Settings Filter Menu
- Navigate to Injection under Injection in the Filter Menu
- Select the inline code format under Automatic Injection- Enables Automatic Injection of RUM Javascript Code Snippet into your Application HTML. (Needed for tying your Application URL Entry Point to the next Underlying Process e.g. HAProxy Load Balancer)
B. Analyze your Application in Dynatrace Cloud
(i) Send some Network Traffic through your Application. e.g. For our MediaWiki Application we hit the http://10.197.203.200:5000/mediawiki MediaWiki Web App URL and sent various Web Requests through the Application Home Page (by clicking on different links on the page)
(ii) Navigate to SmartScape topology in the Filter Menu of your Dynatrace Cloud Instance Portal
Application Layer
(i) Navigate to the Applications Layer
(ii) Select your Application from all the Applications displayed in the Right hand Pane by Hoovering over the Globe Icon displaying your Application Name and then clicking on this Globe Icon e.g. MediaWiki
(iii) If your Application has been setup for Monitoring correctly in Dynatrace Cloud and enough Network Traffic has been detected by Dynatrace for your Application you will see the following for your Application;
- Connection Lines between your Application e.g. MediaWiki in the Application Layer and the underlying Services that it calls in the Services Layer.
- Connection Lines between the Services in the Services Layer and the Processes underpinning these Services in the Processes Layer
- Connection Lines between the Processes in the Processes Layer and the Hosts that these Processes run on in the Hosts Layer
- The Data Center that these Hosts reside in in the Data Centers Layer
Below is an example of this for the MediaWiki Application in our Crucible Lab Environment.

Services Layer
(iv) Navigate to the Services Layer and select 1 of the Services shown for your Application e.g. ardeilmwdtapp02.ares.local Web Request Service. A Service Flow Topology for your Application will be shown in the Right Hand Pane with the Service that you selected highlighted in the Pane, e.g. ardeilmwdtapp02.ares.local Web Request Service as shown below. The full Service Topology is shown depicting how there are 3 Apache Web Servers, each providing an Apache Web Request Service that in turn gets routed to the PHP Application Web Request Service running on the Apache Web Server. All 3 PHP Application Web Request Services are shown calling on the same underlying MySQL Database Service.

Processes Layer
(v) Navigate to the Process Layer and select 1 of the Processes shown for your Application e.g. Apache Web Server httpd. A Process Flow Topology underpinning your Application Services will be displayed in the right hand pane with the Process that you selected highlighted as shown below. The full Process Topology supporting the application is shown depicting how there is a HAProxy process running that routes all Web Requests to an Apache Web Server httpd process which in turn calls on a MySQL Database Server Process when needed.
Note: The Apache Web Request Service and the PHP Application Web Request Service that the Apache Web Server httpd process supports are shown connecting to the Apache Web Server httpd process in the above Services Layer

(vi) Dynatrace groups related Processes into Process Groups. (Refer to the Dynatrace Process Group Process groups documentation page for more information). To see the Process Group that each Process associated with your application belongs to do the following:
- Select 1 of the Processes shown for your Application e.g. Apache Web Server httpd and click on the Expand icon to the right of the Process Name, e.g. Apache Web Server httpd. You are brought to a Process Overview Screen showing your Process Details. The screen below shows the Process Overview screen for the Apache Web Server httpd on ardeilmwdtapp02.ares.local process associated with our MediaWiki Application:

- Select View Process Group from the Context Menu shown in the above screen shot. You are brought to a Process Group Overview screen showing Process Group details associated with the Process Group that your Process is associated with. The screen shot below shows the Process Group details associated with the Apache Web Server httpd Process Group that Dynatrace created for our MediaWiki Application.

All 3 Apache Web Server httpd processes that run in our MediaWiki Apache Web Server Cluster (ardeilmwdtapp01, ardeilmwdtapp02, ardeilmwdtapp03 Linux Servers) are shown in the Process List on this screen, for example the Apache Web Server httpd on ardeilmwdtapp02.ares.local process whose Process Overview was shown in the above screen.
Note: To see all the Process Groups that Dynatrace creates for your environment navigate to Technology & Processes from the Filter Menu. You will be brought to screen showing all the Process Groups in your environment represented as Tiles. The screenshot below shows the Process Groups for our environment represented as Tiles. You will notice the Apache HTTP Server Process Group Tile.

In Dynatrace, it is possible to Tag all Dynatrace Entities. The screen shot below shows all Process Groups associated with our MediaWiki Application that have been Tagged with an 'Application' Tag Key and associated 'MediaWiki' Tag Key Value. (The relevance of Tagging in Dynatrace will be explained in more detail in the Filtering what gets ingested from Dynatrace into the ServiceNow CMDB Subsection of the C. Installing & Configuring Dynatrace Service Graph Connector on your ServiceNow Instance Section below).

Hosts Layer
(vii) Navigate to the Hosts Layer to see what host machine the processes run on as per the screen shot below. Each Apache Web Server http process running on its own host machine, e.g. Apache Web Server httpd process running on the ardeilmwdtapp02 Linux Server.

Data Center Layer
(viii) Navigate to the Data Center Layer to see what Data Center the Hosts are housed in as per the screen shot below.

C. Installing & Configuring Dynatrace Service Graph Connector on your ServiceNow Instance
(i) Login to your ServiceNow Instance
(ii) Install the following Applications & Plugins in the order shown:
Applications
- *Observability Commons for CMDB: sn_observability
- Integrations Commons for CMDB: sn_cmdb_int_util
- CMDB CI Class Model: sn_cmdb_ci_class
- ITOM Discovery License: com.snc.itom.discovery.license (Included with full Discovery Product)
- Event Management: sn_em_ai (for enabling the capturing of events from Dynatrace)
- Service Graph Connector for Observability - Dynatrace: sn_dynatrace_integ
* Observability Commons for CMDB is required for ingesting Events from Dynatrace. It's important that it's installed before Service Graph Connector for Observability - Dynatrace. This is required in order for you to see the Create Default Notification Payload Template step in the Basic and Add Multiple Instances sections of Guided Setup. This step is explained in greater detail in the Event Management Section at the end of this Whitepaper.
Plugins
7. com.glide.hub.action_type.datastream Plugin (ServiceNow IntegrationHub Action Template - Data Stream) - click on the Request Plugin Button from the System Applications Screen
(iii) Navigate to Setup under Dynatrace Observability in the Filter Menu
(iv) Go through all Setup Steps as per the ServiceNow Documentation: Configure Service Graph Connector for Observability - Dynatrace
Specifying what Service Types to Ingest from Dynatrace
In Advanced Settings, Configure Instance Settings ensure to specify All Service Types to be ingested in the Service Types to Ingest field. These will be all the Service Types that your Application relies on. i.e. The Service Types depicted for your Applications in the Services Layer of the Dynatrace Smart Scape Topology for your Application (Described in the 'Services' Step (iv) in the 'Analyse your Application in Dynatrace Cloud' Section above). Out of the Box this Service Types to Ingest field is populated with the WEB_SERVICE, CUSTOM_SERVICE and DATABASE_SERVICE Service Types.
For our sample MediaWiki Application we needed to add the WEB_REQUEST_SERVICE Service Type to this field because, as you can see in the screen shot in the Services Step (iv) in the 'Analyse your Application in Dynatrace Cloud' Section above, the MediaWiki Application has Web Request Services connecting to the underlying Apache Web Server Process. e.g. ardeilmwdtapp02.ares.local Web Request Service connecting to the Apache Web Server httpd process
Filtering what gets ingested from Dynatrace into the ServiceNow CMDB
You can use the Tags field shown on the same Configure Instance Settings page to filter what Applications and associated Services, Processes and Hosts you want to ingest from Dynatrace into the ServiceNow CMDB. Only the Entities in Dynatrace containing the Tags that you specify in this field will be ingested with a cmdb_key_value record being created for each Entity in the Key Value [cmdb_key_value] table
For example, we added an Application tag to the MediaWiki Application and its associated Services, Processes and Hosts in Dynatrace to ensure that only the MediaWiki Application and its associated Services, Processes and Hosts got ingested into the CMDB(The Dynatrace Cloud environment contains other Applications that we didn't want to ingest). A cmdb_key_value record was created in the Key Value [cmdb_key_value] table for the MediaWiki Application and all its associated entities as shown in the screen shot below.

D. Run Dynatrace Service Graph Connector Scheduled Data Import Jobs on your ServiceNow Instance
(i) Navigate to Scheduled Data Imports under Dynatrace Observability in the Filter Menu. 6 Scheduled Import Jobs should be listed as shown below

(ii) Open the SGO-Dynatrace Hosts Parent Scheduled job record and click on the Execute button
(iii) Navigate to Concurrent Import Sets in the Filter Menu.
- Wait for all 6 Scheduled Data Import jobs to finish
For each Scheduled Data Import Job, the following happens:
- Payload Records are created in the appropriate Scheduled Data Import Staging Table with data that is loaded from the Scheduled Data Import Data Source.
- These Payload Records are then passed to the Robust Import Set Transformer associated with the Scheduled Data Import Data Source which in turn Transforms their data as defined by the Robust Import Set Transformer Transform Definition (using the Robust Transform Engine(RTE) ).
- Output Records from the Robust Import Set Transformer are then sent to the Identification & Reconciliation(IRE) Engine for processing.
- The Identification & Reconcilation(IRE) Engine does the following with each Output Record:
- It Creates\Updates the appropriate CI Record in the CMDB
- It Creates a Source Record with Key CI Record data like Source Native Key, Configuration Item and Target Table (CI Type) in the Sources[sys_object_source] Table so that these CI's can be quickly located at a later point when needed, like e.g. during Dynatrace Event Processing (described further down in the G. Event Management Section below).
E. Analyze the Application Service Map created by the Dynatrace Service Graph Connector for your Application in your ServiceNow Instance
(i) Navigate to Application Services under Service Mapping in the Filter Menu.
(ii) Click All to show All Application Service Types
You should see a Calculated Application Service for your Application with the following format: Application Name - APPLICATION-XXXXXXXXXX, e.g. MediaWiki - APPLICATION-A33AB241EDACC4B2 for the MediaWiki Calculated Application Service that was automatically generated at the end of the Scheduled Data Import.
(iii) Click on the View Map button to the right of your Calculated Application Service, e.g. MediaWiki - APPLICATION-A33AB241EDACC4B2 in the case of our MediaWiki Application
An Application Service Map Page should be displayed showing the Service Map for your Application. In the case of our MediaWiki Application the MediaWiki Application Service Map depicts 4 separate Entry Points (shown in the screen shot below), 1 for the Apache Web Server httpd Process Group representing all the Apache Web Server httpd processes that run in our Apache Web Server Cluster (described in the (vi) Process Groups step of the above Processes Layer Subsection) and 1 for each Apache Web Request Service that processes incoming Web Requests from the http://10.197.203.200:5000/mediawiki URL (hosted on the HAProxy Load Balancer).
- Apache Web Server httpd - PROCESS_GROUP-9AA8EFDE2B906FE8 - APPLICATION-A33AB241EDACC4B2
- ardeilmwdtapp01.ares.local - SERVICE-F1F61414FBA29432
- ardeilmwdtapp02.ares.local - SERVICE-3083A71F82164258
- ardeilmwdtapp03.ares.local - SERVICE-979DF09F1DCECB2A

Note: A HAProxy Load Balancer Entry Point is not shown in this Service Map because Dynatrace does not Classify HAProxy Load Balancer as a Service but rather as a Process. i.e. The HAProxy process underpinning the Apache Web Request Service that it supports (s_hown in the screen shot in 'Processes' Step (v) in the 'Analyze your Application in Dynatrace Cloud' Section above_)
(iv) For every Service associated with your Application in Dynatrace, a Calculated Application Service record is created in the ServiceNow CMDB to represent that Service and uses the Service Name - SERVICE-XXXXXXXXXX naming convention for the Service Name. The screenshot below shows all the Service CI records that were created in the Calculated Application Service[cmdb_ci_service_calculated] table to represent the Services associated with the MediaWiki Application. These records were created at the end of the Dynatrace Service Graph Connection Scheduled Job Imports.

All the SERVICE type Calculated Application Services are represented as nested Contained Application Services in your Application's Service Map. e.g. MediaWiki - APPLICATION-A33AB241EDACC4B2. The Root Application Service Map shows the Outermost Contained Application Service(s) with the Service Map for the Services that it is dependent on being shown in a new Window when you select Show Contained Service in its Pull Down Menu.
For example, for the MediaWiki Application, below is a screen shot showing the Service Map for the ardeilmwdtapp02.ares.local - SERVICE-3083A71F82164258 Service contained in the Outermost MediaWiki - APPLICATION-A33AB241EDACC4B2 Root Service Map (shown in the screen shot in step (iii) above) .
It shows the below 2 Entry Points:
- Apache Web Server httpd - PROCESS_GROUP-9AA8EFDE2B906FE8 - SERVICE-3083A71F82164258
Apache Web Server httpd on ardeilmwdtapp02 process in the Apache Web Server httpd - PROCESS_GROUP-9AA8EFDE2B906FE8 Process Group
- PHP on ardeilmwdtapp02.ares.local - SERVICE-BEC89F4DA1D1D748

The screen shot below shows the Service Map for the PHP on ardeilmwdtapp02.ares.local - SERVICE-BEC89F4DA1D1D748 Service Contained within the Outermost ardeilmwdtapp02.ares.local - SERVICE-3083A71F82164258 Contained Service shown in the above Service Map.
It shows the below 2 Entry Points:
- Apache Web Server httpd - PROCESS_GROUP-9AA8EFDE2B906FE8 - SERVICE-BEC89F4DA1D1D748
Apache Web Server httpd running PHP on ardeilmwdtapp02 process in the Apache Web Server httpd - PROCESS_GROUP-9AA8EFDE2B906FE8 Process Group.
The Wikidatabase' Database that the PHP on ardeilmwdtapp02.ares.local - SERVICE-BEC89F4DA1D1D748 Service connects to. It is shown as running on the ardeilmwdtdb01 Linux Server.
The MySQL process that is associated with the MySQL - PROCESS_GROUP-36BAFEFE448A1CAD Process Group is also shown in the Service Map

F. Analyze the CMDB Records created\updated by the Dynatrace Service Graph Connector for your Application in your ServiceNow Instance
(i) Navigate to cmdb_ci.list in the Filter Menu
(ii) Group by Discovery Source
(iii) Navigate to the SGO-Dynatrace Discovery Source and double click on its Discovery source:SGO-Dynatrace(n) link where n represents the Number of CMDB records(entities) Created\Updated by the Dynatrace Service Graph Connector.
Note: If you used the Tags field in the earlier Setup Step to limit what gets ingested to just entities associated with your Application then this number will represent what gets Created\Updated for your Application only.
--> All CMDB CI Records that were created\updated by the Dynatrace Service Graph Connector are listed. If you used Filtering for just your Application as described above, this will be the CMDB CI records for your Application only.
(iv) Group By Class
A List of CMDB CI Records Created\Updated by the Dynatrace Service Graph Connector will be displayed grouped by Class.
- All the Service entities associated with your Application in Dynatrace will be represented as Calculated Application Service Class Records
- All the Process entities associated with your Application in Dynatrace will be represented as Application Class Records in the Class List that is displayed
For Process entities that the Dynatrace Service Graph Connector found a Class Match for lower down the Application Class Hierarchy, these Process entities will be listed under that Class instead of the Application Class e.g. Apache Web Server
- All the Process Group entities associated with your Application in Dynatrace will be represented as Group Class Records in the Class List that is displayed
- All Host entities associated with your Application in Dynatrace will be represented as Computer Class Records in the Class List that is displayed.
1. For Host entities that the Dynatrace Service Graph Connector found a Class Match for lower down the Computer Class Hierarchy, these Host entities will be listed under that Class instead of the Computer Class e.g. Linux Server
2*.* All Entities that are in turn associated with these Computer Class records will shown in the Class List displayed, e.g. IP Address, Software
The screen shot below shows all of the Class Records displayed in this Class List for our MediaWiki Application.

Note: HAProxy Load Balancer is listed as an Application Class as oppose to a Calculated Application Service Class which is the reason why HAProxy Load Balancer is not shown in the MediaWiki Application Service Map described in the E. Analyze Service Map Section above.
G. Event Management
A Dynatrace Observability Push Connector is installed as part of the Service Graph Connector for Observability - Dynatrace installation in the Push Connectors[sn_em_connector_listener] Table on your Instance. This Listener connector listens for Event Messages from your Dynatrace Source. These Events are sent from Dynatrace to your ServiceNow Instance via the EM-Connector Inbound Event REST API using the format
https://{Instance-name}.service-now.com/api/sn_em_connector/em/inbound_event?source=SGO-Dynatrace. The Listener connector parses the data from the Event Messages it receives and does the following:
- Constructs a Source Native Key (SourceNativeKey) from the entityId value that it receives in the Event Message Payload.
- Locates the CI associated with the Event by querying the Sources[sys_object_source] Table using this Source Native Key (Primary Key in the Sources[sys_object_source] Table).
- Creates an Event Record and populates the Configuration Item(sys Id) and Configuration Item Type fields in the Event Record with the output from this query (Binds the CI to the Event).
These Events are then processed by the Event Management Module on your ServiceNow Instance with Alerts being generated for these Events.
Event Management Configuration
There is a Create Default Notification Payload Template step in Dynatrace Guided Setup that you need to follow to enable Dynatrace to push Dynatrace Events to your ServiceNow Instance. Clicking on the Problem Notification Setup pushbutton on this Configuration Page calls a Dynatrace API that in turn creates the following in your Dynatrace Cloud Instance;
- Alerting Profile for your ServiceNow Instance that can be used for setting up fine grained Alert Filtering Rules. A lerting Profile is created with the following format: ServiceNow Default Problem Notification - SN Instance Profile
- Problem Notification for your ServiceNow Instance that will be used by Dynatrace for pushing Events to your ServiceNow Instance by calling the ServiceNow Event Management API.
Problem Notification is created with the following format: ServiceNow Default Problem Notification - SN Instance Name (Custom Integration - Webhook URL, Alerting Profile: ServiceNow Default Problem Notification -SN Instance Name Profile).
- SN Instance Name is the name of your ServiceNow Instance
- W ebhook URL is the URL for the Dynatrace Observability Push Connector (referred to above) that Dynatrace will send your Application Events to i.e. https://{Instance-name}.service-now.com/api/sn_em_connector/em/inbound_event?source=SGO-Dynatrace
- Alerting Profile is the Alerting Profile that was created for your ServiceNow Instance in the above bullet that is now being associated with the Problem Notification being created for your ServiceNow Instance.
Dynatrace is now enabled to push Events to your ServiceNow Instance. These Events then get processed by the Event Management Module in your ServiceNow Instance with Alerts being created as appropriate etc. These Alerts then get shown in the Dynatrace Calculated Service Map similarly to how Alerts from other Monitoring Tools(e.g. Agent Client Collector) get shown when you click on Monitor Service on the Service Map. The screen shot below shows a Critical Alert being displayed for the ardeilmwdtapp02Linux Server(1 of the Apache Web Server nodes) on the MediaWiki - APPLICATION-A33AB241EDACC4B2 Root Service Map.

https://www.servicenow.com/community/architect-articles/dynatrace-service-graph-connector/ta-p/2619549