
Debugging UI Policies
There are different strategies for debugging UI Policy Scripts, UI Policy Actions, and UI Policy conditions.
Debugging UI Policy Scripts
Debug UI Policy Scripts using the same strategies discussed earlier in this module:
- JavaScript Log and jslog()
- try/catch
- Debugging tools built into web browsers (browser dependent)
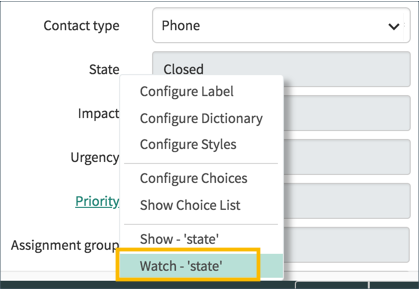
Debugging UI Policy Actions
Use the Field Watcher to debug UI Policy Actions. Select a field to watch by right-clicking the field name on a form and selecting the Watch — ‘’ menu item.
When the UI Policy is triggered, log information for the watched field is written to the Field Watcher log. Note that the UI Policy Short description field value identifies the UI Policy that was applied.
Debugging UI Policy Conditions
Follow these steps to enable UI Policy debugging:
In the main ServiceNow browser window, use the Application Navigator to open System Diagnostics > Session Debug > Debug UI Policies. The module executes a script that turns on logging for UI Policies.
Open the JavaScript Log and Field Watcher.
Open the form of interest and force the UI Policy being debugged to execute by changing field values as necessary to meet the UI Policy condition.
Examine the debugging information in the JavaScript Log.
Note these points in the debugging information:
- The Short description value for the UI Policy and table name.
- The statement of the condition(s) and the result of evaluating that line of the condition.
- The overall value returned by the condition field after evaluating all conditions.
- UI Policy Actions setting field attributes.
When you are done debugging, disable debugging by using the Application Navigator to open System Diagnostics > Session Debug > Disable UI Policies Debug.
https://medium.com/@LearnITbyPrashant/debugging-ui-policies-52a4eac44779?source=rss-d005fc598f0a------2