
CSS Bar Charts Using Modern Functions
 CSS-Tricks
·
Feb 05, 2026
·
article
CSS-Tricks
·
Feb 05, 2026
·
article
New CSS features can sometimes make it easier and more efficient to code designs we already knew how to create. This efficiency could stem from reduced code or hacks, or improved readability due to the new features.
In that spirit, let’s revamp what’s under the hood of a bar chart.
We begin by laying out a grid.
.chart {
display: grid;
grid-template-rows: repeat(100, 1fr);
/* etc. */
}
The chart metric is based on percentage, as in “some number _out of 100_.” Let’s say we’re working with a grid containing 100 rows. That ought to stress test it, right?
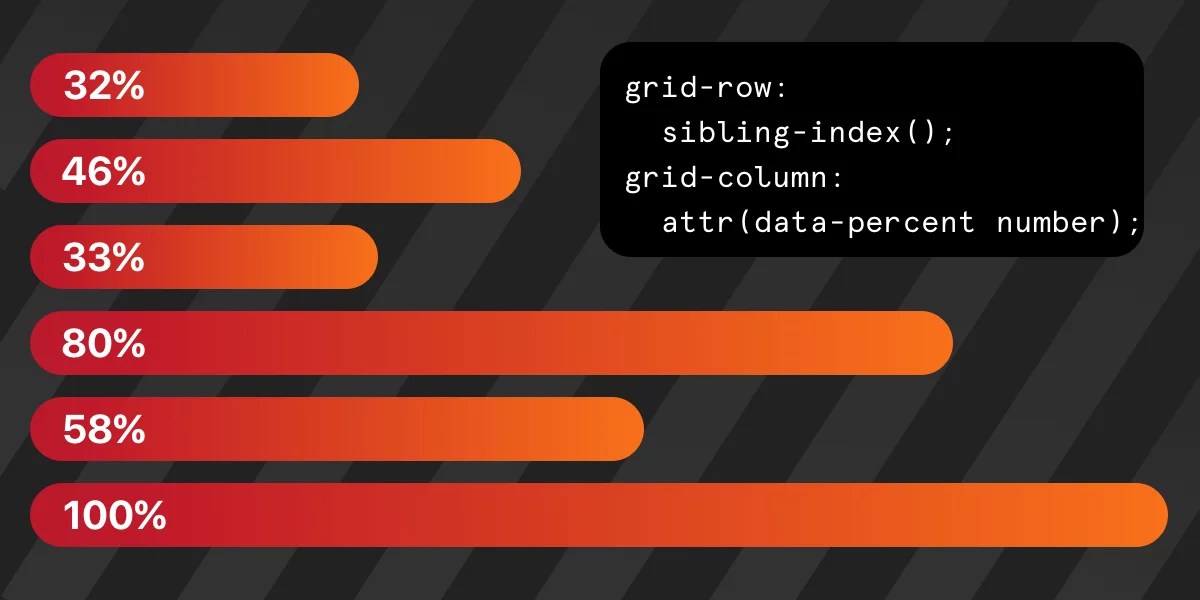
Next, we add the bars to the grid with the `grid-column` and `grid-row` properties:
.chart-bar {
grid-column: sibling-index();
grid-row: span attr(data-value number);
/* etc. */
}
Right off the bat, I want to note a couple of things. First is that [`sibling-index()`](https://css-tricks.com/almanac/functions/s/sibling-index/) function. It’s brand new and has incomplete [browser support](https://caniuse.com/wf-sibling-count) as of this writing (come on, Firefox!), though it’s currently supported in the latest Chrome and Safari (but not on iOS apparently). Second is that [`attr()`](https://css-tricks.com/almanac/functions/a/attr/) function. We’ve had it for a while, but it was recently upgraded and [now accepts data-attributes](https://amitmerchant.com/attr-function-types-css/). So when we have one of those in our markup — like `data-value="32"` — that’s something the function can read.
With those in place, that’s really all we need to create a pretty darn nice bar chart in vanilla CSS! The following demo has fallbacks in place so that you can still see the final result in case your browser hasn’t adopted those new features:
//codepen.io/anon/embed/ZYOOvmb?height=450&theme-id=1&slug-hash=ZYOOvmb&default-tab=result
Yes, that was easy to do, but it’s best to know exactly _why_ it works. So, let’s break that down.
### Automatically Establishing Grid Columns
Declaring the `sibling-index()` function on the `grid-column` property _explicitly_ places the list items in consecutive columns. I say “explicit” because we’re telling the grid exactly where to place each item by its `data-value` attribute in the markup. It goes first `
That’s the power of `sibling-index()` — the grid intelligently generates the order for us [without having to do it manually](https://css-tricks.com/how-to-wait-for-the-sibling-count-and-sibling-index-functions/) through CSS variables.
/* First bar: sibling-index() = 1 */
grid-column: sibling-index();
/* ...results in: */
grid-column: 1;
grid-column-start: 1; grid-column-end: auto;
/* Second bar: sibling-index() = 2 */
grid-column: sibling-index();
/* ...results in: */
grid-column: 2;
grid-column-start: 2; grid-column-end: auto;
/* etc. */
### Automatically Establishing Grid Rows
It’s pretty much the same thing! But in this case, each bar occupies a certain number of rows based on the percentage it represents. The grid gets those values from the `data-value` attribute in the markup, effectively telling the grid how tall each bar in the chart should be.
/* First bar: data-value="32" */
grid-row: span attr(data-value number);
/* ...results in: */
grid-row: span 32
/* Second bar: data-value="46" */
grid-row: span attr(data-value number);
/* ...results in: */
grid-row: span 46
The `attr()` function, when provided with a _data type_ parameter (the parameter value `number` in our case), [casts the value retrieved by](https://developer.mozilla.org/en-US/docs/Web/CSS/Reference/Values/attr#return_value) [`attr()`](https://developer.mozilla.org/en-US/docs/Web/CSS/Reference/Values/attr#return_value) [into that specific type](https://css-tricks.com/almanac/functions/a/attr/#aa-css-attr-data-types). In our example, the `attr()` function returns the value of `data-value` as a `` type, which is then used to determine the number of rows to span for each bar.
### Let’s Make Different Charts!
Since we have the nuts and bolts down on this approach, I figured I’d push things a bit and demonstrate how we can apply the same techniques for all kinds of CSS-only charts.
For example, we can use `grid-row` values to adjust the vertical direction of the bars:
//codepen.io/anon/embed/azZBNQL?height=450&theme-id=1&slug-hash=azZBNQL&default-tab=result
Or we can skip bars altogether and use markers instead:
//codepen.io/anon/embed/WbxowYb?height=450&theme-id=1&slug-hash=WbxowYb&default-tab=result
//codepen.io/anon/embed/YPWpqRO?height=450&theme-id=1&slug-hash=YPWpqRO&default-tab=result
We can also swap the columns and rows for horizontal bar charts:
//codepen.io/anon/embed/pvbNyqy?height=450&theme-id=1&slug-hash=pvbNyqy&default-tab=result
### Wrapping up
Pretty exciting, right? Just look at all the ways we used to pull this stuff off before the days of `sibling-index()` and an upgraded `attr()`:
- [Making Charts with CSS](https://css-tricks.com/making-charts-with-css/) (Robin Rendle, 2015)
- [Making A Bar Chart with CSS Grid](https://css-tricks.com/making-a-bar-chart-with-css-grid/) (Robin Rendle, 2017)
- [More CSS Charts, with Grid & Custom Properties](https://css-tricks.com/css-charts-grid-custom-properties/) (Miriam Suzanne, 2017)
- [Overlapping Bar Charts](https://css-tricks.com/overlapping-bar-charts/) (Saleh Mubasher, 2022)
* * *
[CSS Bar Charts Using Modern Functions](https://css-tricks.com/css-bar-charts-using-modern-functions/) originally published on [CSS-Tricks](https://css-tricks.com), which is part of the [DigitalOcean](https://try.digitalocean.com/css-tricks/?utm_medium=rss&utm_source=css-tricks.com&utm_campaign=family_&utm_content=) family. You should [get the newsletter](https://css-tricks.com/newsletters/).
https://css-tricks.com/css-bar-charts-using-modern-functions/