
Download PowerBI Diagram for visualizing overrides using Sankey
21 Jan

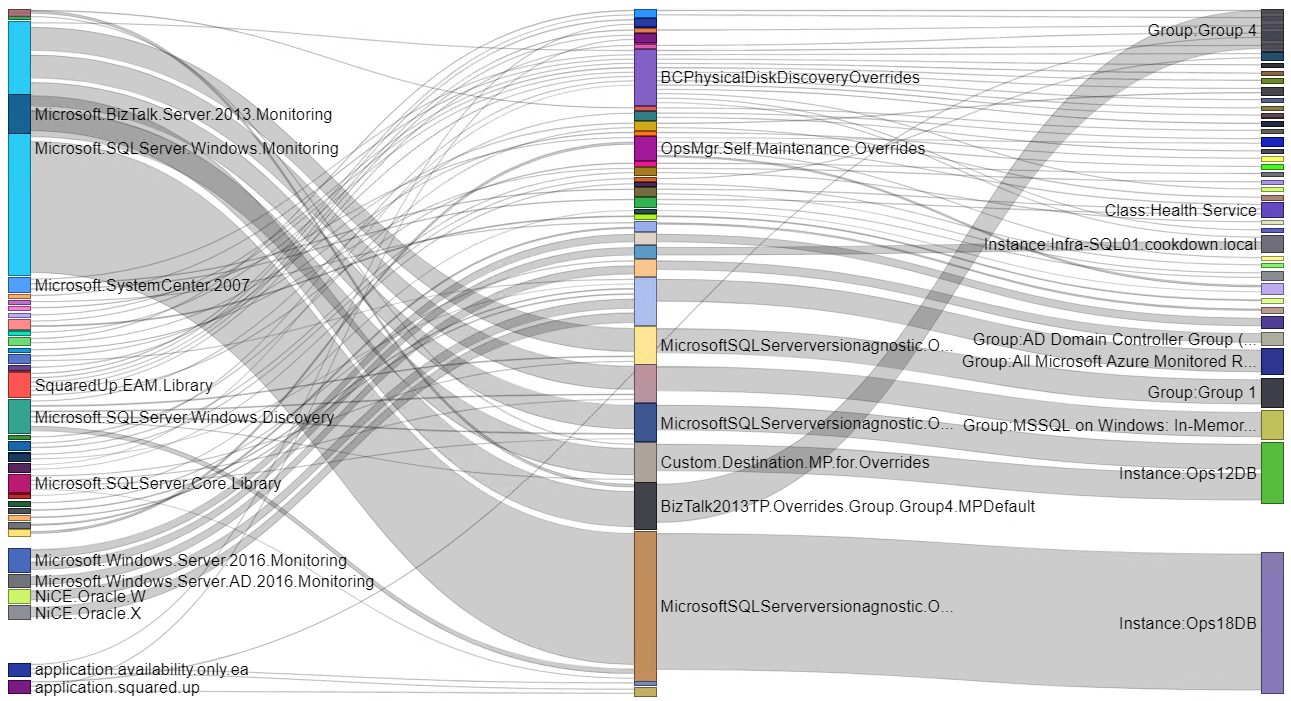
Sankey diagrams in action visualizing a whole management group’s overrides
Setup and user guide
The PowerBi Sankey file comes with a sample set of data from the Cookdown labs as seen in the webinar.
By default there are four tabs along the bottom of the document that can be used to change between each of the available diagrams.

If you wish to narrow down the scope of the diagrams (for example to pick out a particular management pack) you can pop out the filters (from the right hand side by default) of each tab and narrow down the data as you see fit. Basic filters allow you to select individual items from a list and Advanced filters can be used to work with patterns of data.

To change the source of the query and retrieve data from your own management group, select ‘Transform data‘ from the home tab of the ribbon, followed by ‘Edit parameters‘.

Fill in the details (there are some examples included in the drop-down menus) and press OK.

Apply the changes and refresh the data when prompted.

Review and run any ‘Native Database Query’ prompts (there should be four).

If your current account does not have access to the database at this stage, you will be prompted to input valid credentials for the connection.
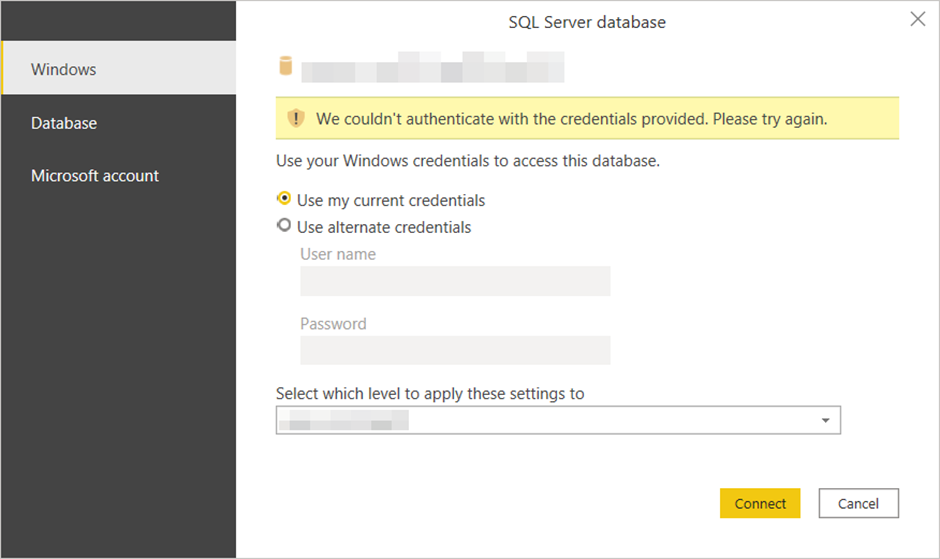
There is potential for errors at this stage in the process depending on your environment.

If you encounter something similar please try running Power Bi using the ‘Run as administrator‘ option before opening the document and connecting to the data source.

https://www.cookdown.com/blog/powerbi-sankey-diagrams-for-visualizing-overrides