
CMDB and CSDM Data Foundations Dashboard Performance
 New article articles in ServiceNow Community
·
Jul 29, 2025
·
article
New article articles in ServiceNow Community
·
Jul 29, 2025
·
article
Overview
The dashboards implement a sophisticated batching strategy designed to process large datasets efficiently while preventing resource exhaustion. This approach is crucial for handling metrics that need to analyze thousands or millions of records without causing system performance issues.
How the Batching Strategy Works
- Time-Limited Execution:
- Each job runs for a maximum of 10 minutes
- After reaching the time limit, the job is killed
- The system waits for 1 minute to release resources
The job is then restarted automatically
- Stateful Processing:
- Stateful Processing:
Context data is preserved between job executions
When restarted, the job knows exactly where it left off
Metric-Specific Runtime Thresholds
Each metric in the CMDB and CSDM Data Foundation Dashboards has its own configurable thresholds defined in the sn_getwell_metric table:
- Runtime Threshold: Maximum acceptable execution time for the metric
- Fail Count Threshold: Number of consecutive failures allowed before automatic deactivation
This per-metric configuration allows for fine-tuned performance monitoring, as different metrics may have varying complexity and resource requirements.
Automatic Deactivation Mechanism
The system includes a self-protection mechanism to prevent persistently problematic metrics from impacting overall system performance:
- If a metric exceeds its runtime threshold consecutively for the number of times specified in its fail count threshold, it is automatically deactivated
- Once deactivated, the metric will not run in future scheduled jobs
- A user with appropriate permissions must manually reactivate the metric after investigating and potentially optimizing it
This prevents resource-intensive metrics from continuously causing performance issues while allowing administrators to address the underlying problems.
Execution Statistics and Audit Trail
The system maintains comprehensive records of metric executions and status changes:
1. Execution Statistics (sn_getwell_metric_execution_stats table)
- Records each execution of a metric
- Tracks whether the execution completed successfully or exceeded its runtime threshold
- Maintains a history of previous runs to identify patterns of performance issues
- Helps administrators diagnose which metrics are consistently problematic
2. Activation Audit (sn_getwell_metric_activation_audit table)
- Records all changes to metric activation status
- Distinguishes between manual deactivation by users and automatic deactivation due to repeated failures
- Provides an audit trail for compliance and troubleshooting purposes
- Helps track the history of problematic metrics
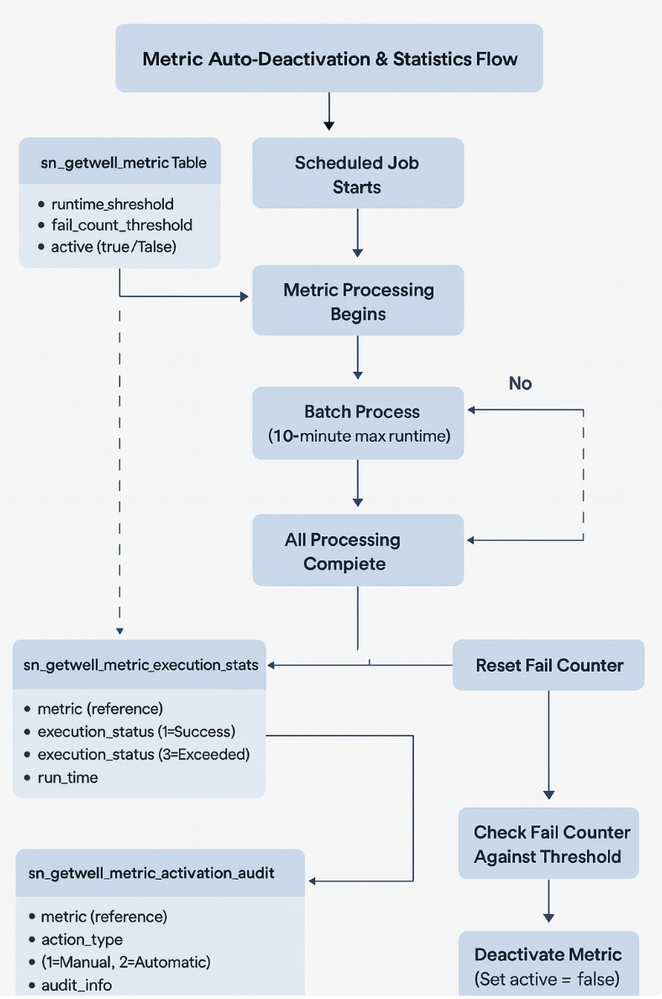
Complete Workflow with Protection Mechanisms
Here's how the entire process works with these additional safeguards:
- Scheduled job starts metric calculation
- Batch processing begins with time limits (max 10 minutes per execution)
- Job context is saved between batches for continuity
- System tracks total execution time for the metric
- If runtime exceeds the metric's threshold:
- Execution statistics record is marked as "exceeded"
- Failure counter for the metric is incremented
- Execution statistics record is marked as "exceeded"
- If failure counter reaches the fail count threshold:
- Metric is automatically deactivated
- An entry is added to the activation audit table
- The metric is excluded from future scheduled runs
- Metric is automatically deactivated
- If execution completes successfully:
- Results are stored and displayed in the dashboard
- Execution statistics record is marked as "completed"
- Failure counter is reset
- Results are stored and displayed in the dashboard
This comprehensive approach ensures that the CMDB and CSDM Data Foundation Dashboards remain performant and reliable even when dealing with extremely large datasets or complex metrics. It provides both automatic protection and detailed visibility into the system's operation, allowing administrators to focus on optimizing problematic metrics rather than constantly troubleshooting performance issues.

Metric Adoption
CMDB Metrics
| Metric Category | Metric Name | Fix Strategy | Version | PRB | Playbook KB Article |
|---|---|---|---|---|---|
| CMDB | Unique Locations | Batching | v4.1.1+ | PRB1798752 | KB0832200 |
| CMDB | CIs Processed via IRE | Batching | v2.6.1+ | PRB1553457 | KB0829078 |
| CMDB | Hardware CIs with Serial Numbers | Batching | v4.2+ | PRB1906065 | KB0829077 |
| CMDB | CIs with Relationships to Parent and Child | Batching | v4.1.2+ | PRB1824667 | KB0829101 |
| CMDB | Custom CMDB Attributes at the Right Level | N/A | N/A | N/A | KB0832206 |
| CMDB | Create Asset Business Rule is Enabled | N/A | N/A | N/A | KB0829855 |
| CMDB | Use of Custom Attributes | N/A | N/A | N/A | KB0832208 |
| CMDB | Active CIs Updated in Last 90 days | N/A | N/A | N/A | KB0829106 |
| CMDB | Base System Relationship Types Not Deleted or Recreated | N/A | N/A | N/A | KB0829857 |
| CMDB | Changes Referencing a CI | N/A | N/A | N/A | KB0868259 |
| CMDB | Changes Relating to both a Service and a CI | N/A | N/A | N/A | KB1116973 |
| CMDB | CIs with Names | N/A | N/A | N/A | KB0829852 |
| CMDB | Base System Business Application Table Usage | N/A | N/A | N/A | KB0868431 |
| CMDB | Custom CMDB Tables Using Standard Naming | N/A | N/A | N/A | KB1116975 |
| CMDB | Base System CMDB Relationship Types Usage | N/A | N/A | N/A | KB0829858 |
| CMDB | Incidents Referencing a CI | N/A | N/A | N/A | KB0864671 |
| CMDB | Incidents Relating to both a Service and a CI | N/A | N/A | N/A | KB1116972 |
| CMDB | Managed CIs with Model Entries | N/A | N/A | N/A | KB0832205 |
| CMDB | Installed Server CI Naming Reflecting Hostname | N/A | N/A | N/A | KB0864735 |
| CMDB | Services with Owners | N/A | N/A | N/A | KB0869040 |
| CMDB | Servers with Location | N/A | N/A | N/A | KB0966472 |
| CMDB | Handled Duplicate CIs | N/A | N/A | N/A | KB0829103 |
CSDM Metrics
| Metric Category | Metric Name | Fix Strategy | Version | PRB | Playbook KB Article |
|---|---|---|---|---|---|
| CSDM | Application Services with 'Consumes::Consumed By' Relationship to Business Application | Batching | v4.1.1+ | PRB1791979 | KB0831503 |
| CSDM | Application Services with Business Application Relationships | Batching | v4.1.1+ | PRB1791979 | KB0831505 |
| CSDM | Business Application with Application Service Relationship | Batching | v4.1.1+ | PRB1791979 | KB0831506 |
| CSDM | Application Services with Business Service Offering Relationship | Batching | v4.1.1+ | PRB1805774 | KB0831510 |
| CSDM | Business Service Offerings with Application Service Relationship | Batching | v4.1.1+ | PRB1805774 | KB0831511 |
| CSDM | Business Application with Information Object Relationship | Batching | v4.1.2+ | PRB1862653 | KB0831515 |
| CSDM | Information Objects with Business Application relationship | Batching | v4.1.2+ | PRB1862653 | KB0831514 |
| CSDM | Product Instance 2.0 Model Enabled | N/A | N/A | N/A | KB1703219 |
| CSDM | Configuration Item Status Values | N/A | N/A | N/A | KB0952946 |
| CSDM | CIs with Matching Operational Status and Life Cycle Stage | N/A | N/A | N/A | KB1703220 |
| CSDM | Business Units with Companies | N/A | N/A | N/A | KB0864259 |
| CSDM | Base System Service Tables | N/A | N/A | N/A | KB0831513 |
| CSDM | Dynamic CI Groups with CMDB Group | N/A | N/A | N/A | KB0952944 |
| CSDM | Locations with Parents | N/A | N/A | N/A | KB0864260 |
| CSDM | Named Product Models with Product Owners | N/A | N/A | N/A | KB0864257 |
| CSDM | Services Using Base System CMDB Tables | N/A | N/A | N/A | KB0831512 |
| CSDM | Technical Service Offerings with Support Group or Change Group | N/A | N/A | N/A | KB0952941 |
| CSDM | Technical Service Offering with Reference to Technical Service | N/A | N/A | N/A | KB0831509 |
Additional Resources
CMDB Data Foundations Dashboard product documentation
CSDM Data Foundations Dashboard product documentation
Next Step
CMDB and CSDM Data Foundations Dashboard Common Error Scenarios
https://www.servicenow.com/community/cmdb-articles/cmdb-and-csdm-data-foundations-dashboard-performance/ta-p/3335668