
Unlock your ServiceNow Monitoring with Dashboards
Rather than you having to build your own dashboard and understand what pieces of our MP are important, we’ve done the hard bit for you!
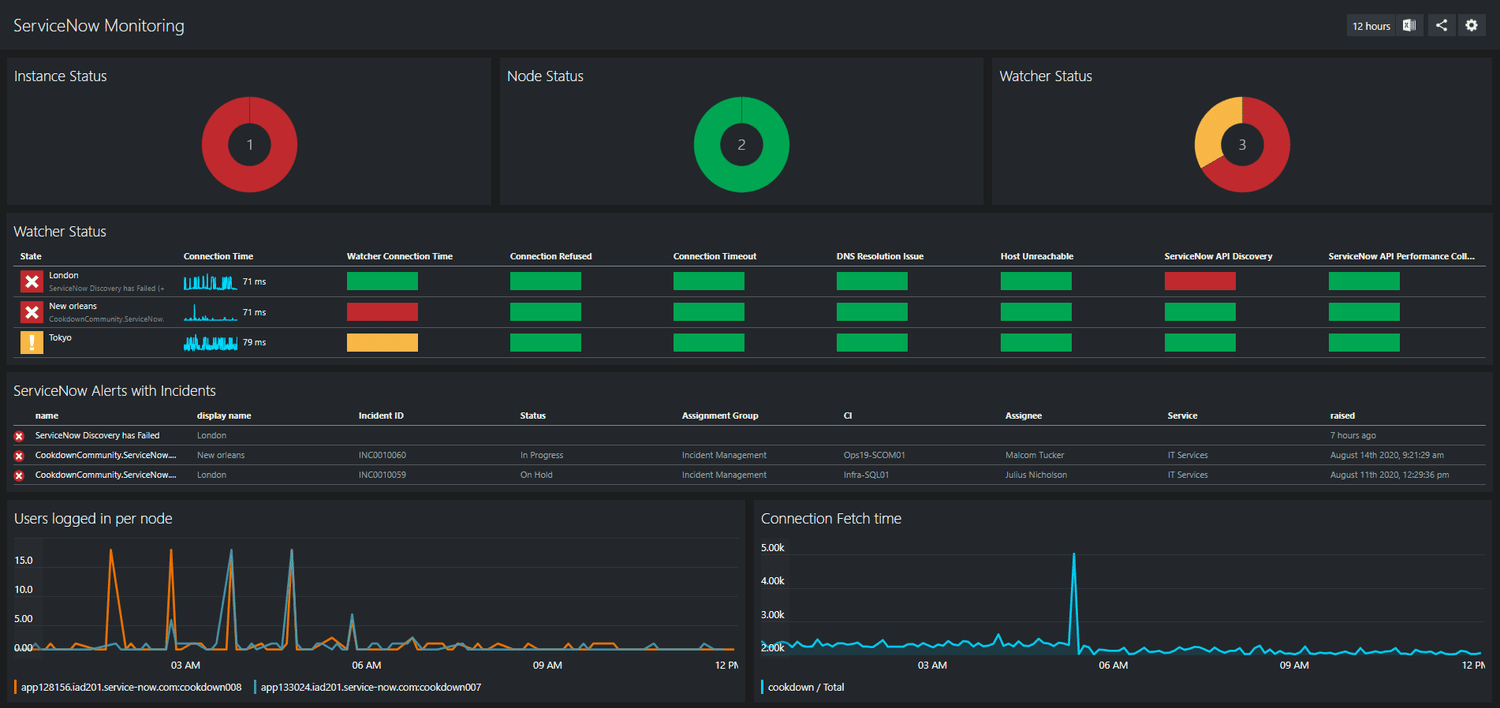
We roll up the status for your Instance(s), node(s) and watchers in the three donuts at the top of the dashboard, so it only takes a quick glance to see what needs your attention.
On the second row we look at the watchers in more detail, if a watcher is red, why? Are there DNS issues preventing name resolution? Is latency fluctuating at certain times of the day? Is your instance simply not accessible?
Row three illustrates any alerts our MP generates, which can be raised for ServiceNow instance latency issues, connection issues (such as DNS resolution failures, connection refusals and timeouts), discovery failures and more.
If you have Cookdown Alert Sync, this tile will show Incident info on any of the alerts pushed to ServiceNow, as the incident data is pulled back into ServiceNow, via the Alert Sync’s bi-directional sync feature.
https://www.cookdown.com/blog/servicenow-monitoring-unlocked-with-dashboards